Customer Satisfaction Survey Questions: 40 Examples to Use
On this page

The best customer satisfaction survey asks one clear rating question about one specific moment, follows it with one open "why" question, and stops there. For most support teams that means: "How satisfied were you with the help you received today?" on a 1 to 5 scale, then "What is the main reason for your score?" Everything else is optional and should earn its place.
That sounds almost too simple, so this guide gives you the full toolkit: 40 customer satisfaction survey questions grouped by the moment you want to measure, the three scales that matter (CSAT, NPS and CES) and when to use each, research on how survey length affects answers, the wording mistakes that quietly ruin data, and what to do with the scores once they arrive.
In this guide
- What makes a good customer satisfaction survey question
- CSAT vs NPS vs CES
- 40 customer satisfaction survey questions by moment
- How long should a customer satisfaction survey be
- Survey question mistakes that skew your results
- From scores to action in your help desk
- Sources
What makes a good customer satisfaction survey question
A good survey question is one that a customer can answer in a few seconds without guessing what you mean, and one whose answer you already know how you will act on. If you cannot name the decision a question feeds, cut it.
The American Association for Public Opinion Research (AAPOR) puts the basics plainly in its best practices for survey research: questions "should be specific and ask only about one concept at a time," should be "short and simple," and should be free of language that pushes people toward an answer. Those three rules alone would fix most customer surveys we see.
Ask about one moment, not the whole relationship
"How satisfied are you with our company?" is hard to answer honestly. Is the customer thinking about the product, the price, or the agent who helped yesterday? A transactional question ("How satisfied were you with how we handled your request today?") points to one event, so the answer is something your team can actually improve.
Put general questions before specific ones
AAPOR also notes that it is often better for general questions to come before specific questions about the same concept, because earlier questions can prime later answers. In practice: ask for the overall rating first, then ask about speed, tone, or accuracy. If you ask "Was our agent friendly?" first, the overall score that follows tends to lean on friendliness.
Label your scale in words
Nielsen Norman Group notes in its guide to rating scales that scales with unlabeled options place a higher cognitive demand on the person answering. "Very dissatisfied" to "Very satisfied" beats a bare row of numbers, especially on mobile where the scale may wrap.
Pro tip: Write the follow-up action before the question. For each question, finish the sentence "If this score drops, we will..." If you cannot finish it, the question is decoration, not data.
CSAT vs NPS vs CES
Most customer satisfaction survey questions are variations of three standard metrics. Each one answers a different question, and mixing them up is the most common reason teams end up with numbers they cannot interpret.
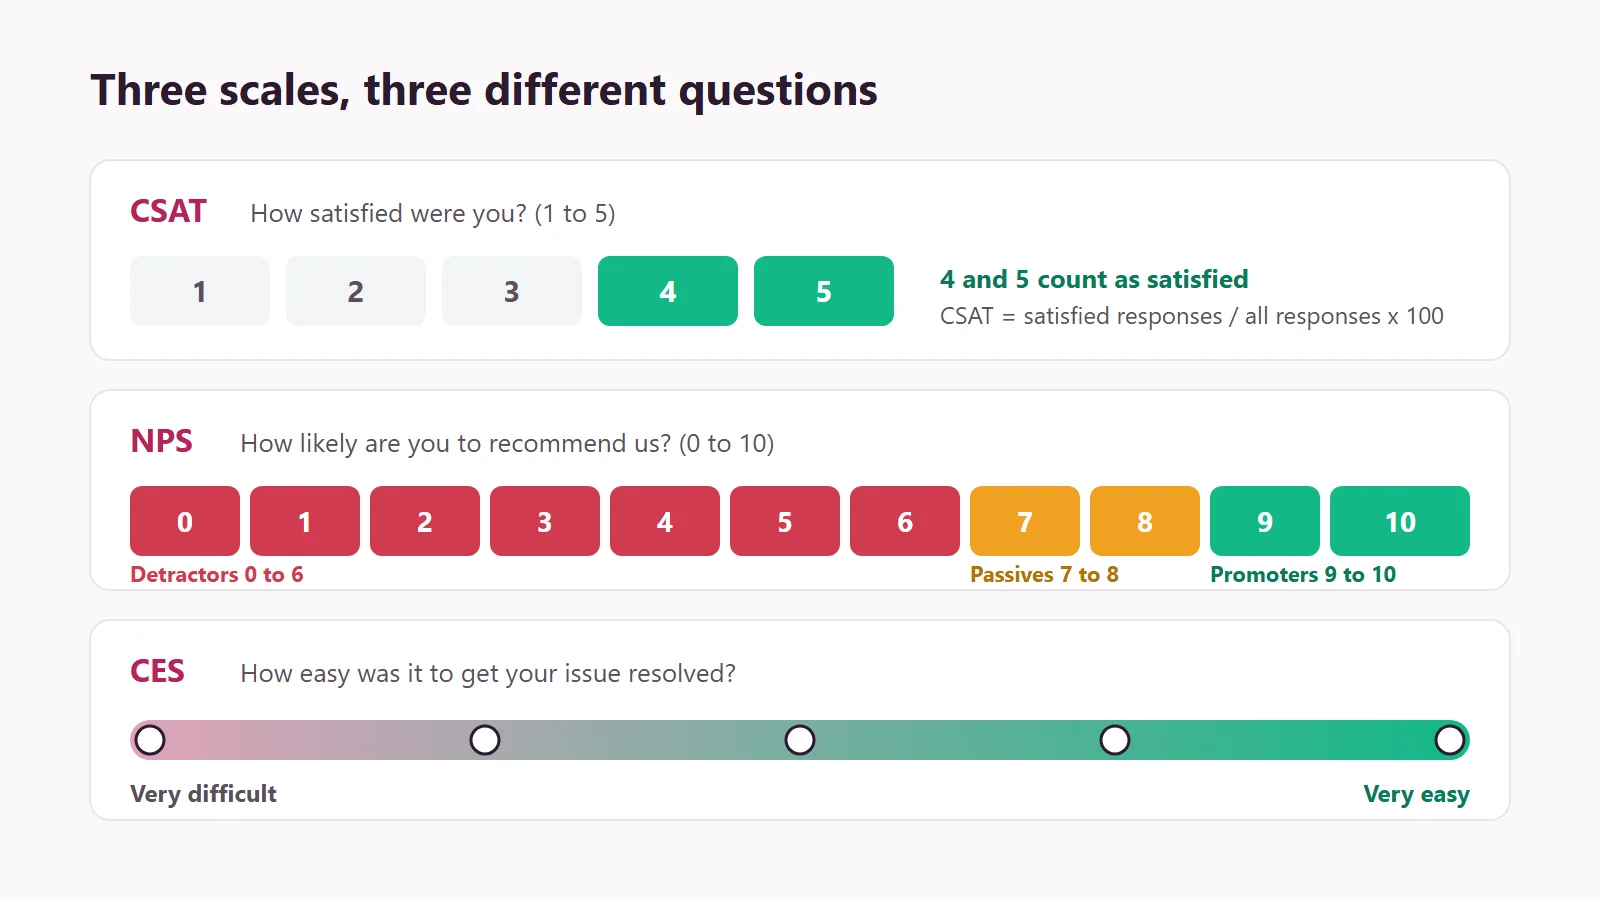
CSAT (Customer Satisfaction Score) asks how satisfied someone was, usually on a 1 to 5 scale. According to Qualtrics, you calculate it from the responses of 4 (satisfied) and 5 (very satisfied): divide those by the total number of responses and multiply by 100. Qualtrics also states that using the two highest values has been shown to be the most accurate predictor of customer retention. Our CSAT calculator runs the formula for you, and the CSAT guide covers benchmarks and reporting in more depth.
NPS (Net Promoter Score) asks one fixed question. Bain's Net Promoter System phrases it as "How likely are you to recommend us to a friend or colleague?" scored from 0 to 10. Your score is the percentage of promoters (9 or 10) minus the percentage of detractors (0 to 6). Bain also notes that passives (7 or 8) have repurchase and referral rates as much as 50% lower than promoters. The idea dates back to Fred Reichheld's 2003 Harvard Business Review article The One Number You Need to Grow, which argues that companies spend lots of time and money on complex tools to assess customer satisfaction while measuring the wrong thing. We cover the full question set in our guide to NPS survey questions, and the NPS calculator handles the math.
CES (Customer Effort Score) asks how easy it was to get an issue resolved. Qualtrics traces it to 2010 research from CEB, which found that reducing customer effort is a higher indicator of loyalty than delight. The same idea runs through the 2010 Harvard Business Review article Stop Trying to Delight Your Customers, which questions the entrenched belief that companies must go above and beyond in every service interaction.
| Metric | Core question | Scale | Best moment to ask | What it tells you |
|---|---|---|---|---|
| CSAT | How satisfied were you with...? | 1 to 5 | Right after a ticket, purchase or onboarding step | Quality of one specific interaction |
| NPS | How likely are you to recommend us? | 0 to 10 | On a schedule, such as quarterly | Overall loyalty and word of mouth |
| CES | How easy was it to get your issue resolved? | Very difficult to very easy | Right after a support conversation closes | Friction in your process |
Our honest take: for a small support team, CSAT after resolved tickets plus a quarterly NPS is plenty. CES is valuable, but if you only have bandwidth for one post-ticket question, CSAT is easier for customers to understand and easier for you to explain to the rest of the business.
40 customer satisfaction survey questions by moment
Pick two or three questions from the group that matches the moment you are measuring. Do not send all of them. Each group starts with the rating question and ends with open follow-ups.
After a support conversation (customer service survey questions)
These are the questions most help desks send when a ticket is solved. Keep this survey to one or two questions, because the customer just spent time on you already.
- How satisfied were you with the help you received today? (Very dissatisfied to Very satisfied)
- Did we fully resolve your issue? (Yes / Partly / No)
- How easy was it to get your issue resolved? (Very difficult to Very easy)
- How would you rate the speed of our first reply?
- How clear was the explanation you received?
- Did you have to repeat any information to us? (Yes / No)
- How knowledgeable was the person who helped you?
- Is there anything we could have done to make this easier?
Question 6 deserves special attention. Qualtrics, citing CEB research, lists repeating information, switching channels, and being transferred to a different agent among the indicators of a high-effort experience, so a simple yes or no here points straight at handoff problems. If you use an AI agent for first responses, this is the question that tells you whether its handoff summary actually reaches the human. (Kora Reply's AI agent passes a written summary to the agent for exactly this reason.)
After purchase or onboarding (customer experience survey questions)
- How satisfied are you with your purchase so far?
- How easy was it to get started?
- Did the product match what you expected when you signed up? (Better / About the same / Worse)
- How satisfied were you with the setup instructions?
- Which part of getting started took the most time?
- Was anything missing that you expected to find?
- How likely are you to keep using the product next month?
- What almost stopped you from buying?
Product and feature feedback
- How satisfied are you with [feature name]?
- How often do you use [feature name]? (Daily / Weekly / Monthly / Rarely)
- How well does the product meet your needs? (Not at all to Completely)
- Which feature would you miss most if it disappeared?
- Which feature do you use least, and why?
- How satisfied are you with the value for the price you pay?
- What is one thing we should improve first?
- What problem were you trying to solve when you chose us?
Self-service, help center and website
Self-service surveys are short by nature: a widget at the bottom of an article or a one-line prompt after a search.
- Did this article answer your question? (Yes / No)
- How easy was it to find what you were looking for?
- What were you searching for today?
- Was anything in this article unclear or out of date?
- Did you need to contact support after reading this? (Yes / No)
- How satisfied are you with our help center overall?
- What topic should we write about next?
A "No" on question 25 or a "Yes" on question 29 is the most actionable signal in this list: it names a specific article that is failing. If your knowledge base also feeds an AI agent, those same articles are what the AI answers from, so fixing them improves two channels at once.
Open-ended follow-ups that explain the score
Use exactly one of these after any rating question. Nielsen Norman Group's guide to qualitative surveys warns that people quickly tire of answering many open-ended questions, which usually require a lot of typing.
- What is the main reason for your score?
- What is one thing we could do better?
- What did we do well that we should keep doing?
- If you could change one thing about your experience, what would it be?
- Is there anything else you would like us to know?
- What would have made this a 5 out of 5?
- Who else on your team should we talk to about this?
- May we contact you about your answers? (Yes / No)
- What nearly made you contact a competitor instead?
Key takeaway: One rating plus one "why" beats ten ratings. The rating tells you where to look. The open answer tells you what to fix. Anything beyond that is usually curiosity, not decision-making.
If you would rather start from a ready layout, our free customer satisfaction survey template turns any of these questions into a form you can copy.
How long should a customer satisfaction survey be
Shorter than you think. SurveyMonkey analyzed a random sample of roughly 100,000 surveys of 1 to 30 questions and found that respondents spend about 75 seconds on the first question (including any intro text) and about 5 minutes in total on a 10 question survey.
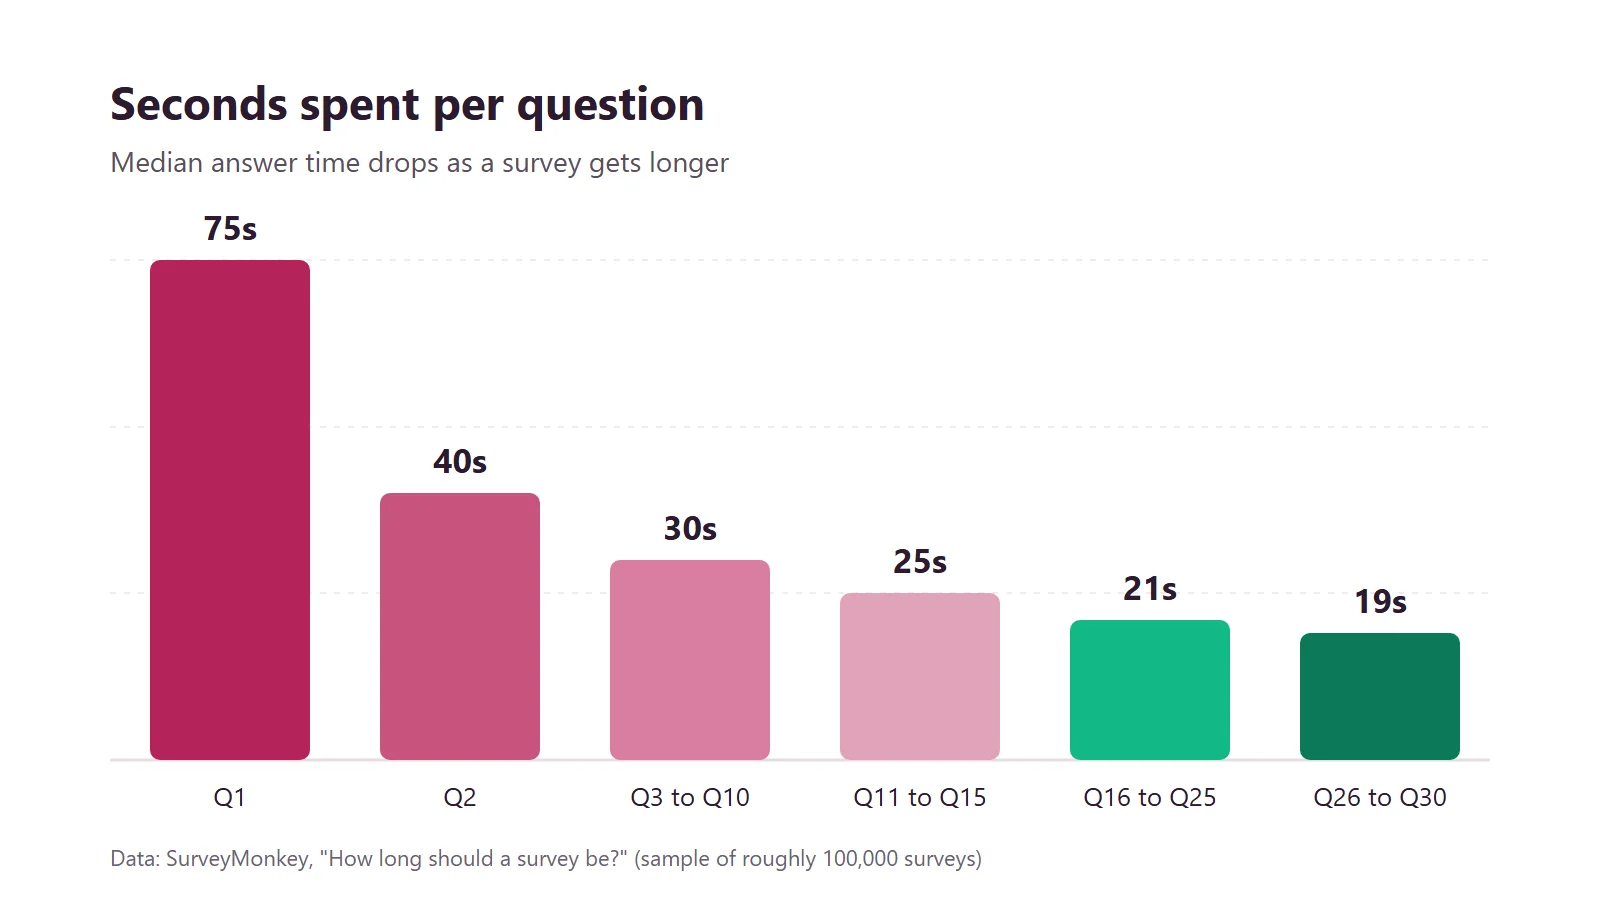
The more interesting finding is what happens as the survey grows. Time per question drops from about 30 seconds on questions 3 to 10 down to about 19 seconds by questions 26 to 30. SurveyMonkey describes this as respondents "satisficing," or speeding through, which hurts data quality. It also saw abandon rates increase for surveys taking more than 7 to 8 minutes, with completion rates dropping anywhere from 5% to 20%.
The detail that matters most for support teams: SurveyMonkey found tolerance for long surveys was greater for work or school surveys and lower when they were customer related. Your customers owe you nothing, and they know it.
Benchmark: Keep post-ticket surveys under one minute. One rating question plus one optional open question fits comfortably inside the time people spend on just the first question of a typical survey.
Here is a contrarian point worth making. Many teams try to fix low response rates by sending surveys to more people more often. That usually makes the data worse, because the customers who answer every survey are not typical. Nielsen Norman Group suggests it is better to send two short surveys to two different groups of customers than to cram everything into one long survey the average customer will not finish. Rotating questions across segments gets you more coverage with less fatigue.
Survey question mistakes that skew your results
Bad wording does not throw an error. It just produces numbers that look fine and mean little. These are the patterns we would remove first.
| Mistake | Bad version | Better version |
|---|---|---|
| Double-barreled (two questions in one) | How satisfied were you with the speed and quality of our reply? | How satisfied were you with the speed of our reply? (Ask quality separately.) |
| Leading wording | How great was your experience with our friendly team? | How would you rate your experience with our team? |
| Agreement statements | Our support team solved my problem quickly. (Agree / Disagree) | How quickly was your problem solved? (Very slowly to Very quickly) |
| Unlabeled scale | Rate us 1 to 10. | 1 = Very dissatisfied, 5 = Very satisfied, with every point labeled |
| Vague time frame | How often do you contact support? | In the last 30 days, how many times did you contact support? |
| Asking about the future as fact | Will you buy from us again? | How likely are you to buy from us again? |
The "agreement statements" row is the subtle one. Nielsen Norman Group notes that Likert-style agree or disagree questions are vulnerable to acquiescence bias (the tendency to agree) and social desirability bias (the tendency to give the answer that seems polite). A question that asks for a rating of the thing itself sidesteps both.
Do not survey after every single message
Survey fatigue is real, and it hits your best customers hardest because they contact you most. Our recommendation is to survey each customer at most once in a set period (for example, once every 30 days), no matter how many tickets they open. You lose a little volume and gain answers that reflect how people actually feel.
Watch the closed versus open balance
AAPOR notes that closed questions place less burden on respondents and are easier to interpret, but are more likely to influence how people answer. That is a good argument for always leaving one open box, even if most people skip it. The few who write something are often the ones with the most important thing to say.
Pro tip: Test your survey on three colleagues first. Ask them to read each question aloud and explain what it means. If two of them interpret a question differently, rewrite it before a single customer sees it.
From scores to action in your help desk
A customer satisfaction survey is only worth sending if someone reads the answers and does something. The most useful setup links every response back to the conversation it rates, so a low score is never just a number on a chart. It is a ticket you can open, a reply you can read, and a customer you can contact.
Follow up on low scores within a day
Treat every 1 or 2 rating as a new piece of work. Reopen or create a follow-up, assign it to a person, and give it a response target like any other priority ticket. Tools with SLA management make this easy to enforce, because the follow-up gets the same deadline tracking as a normal request. A short, personal reply to a detractor often does more for loyalty than the original fix did. Our guide to writing a customer service email has templates for exactly this kind of message.
Look for patterns, not single scores
Once you have a few weeks of answers, group low scores by cause: slow first reply, wrong answer, repeated information, missing help article. In a ticketing system with tags and internal notes, this is a filter, not a spreadsheet project. If one cause dominates, that is your next process change. Many of the fixes are good candidates for customer service automation, such as auto-routing a topic that keeps getting bounced between people.
Close the loop with the whole team
Share the top three themes in your regular team meeting, alongside one real quote from a customer. Numbers start debates. Quotes start fixes. If your team works from a shared inbox, everyone already sees the conversations behind the scores, which makes the discussion faster.
A note on Kora Reply itself: we are a new help desk for small teams, and built-in CSAT surveys and reporting are on our roadmap rather than live today. Until they ship, you can collect answers with any survey tool, use our free survey template and CSAT calculator, and handle the follow-up work inside Kora Reply tickets. You can see what is included on each plan on the pricing page.
Frequently asked questions
Start with one rating question tied to a specific moment, such as "How satisfied were you with the help you received today?" on a 1 to 5 scale, then add one open question: "What is the main reason for your score?" Those two cover most needs. Add an effort question ("How easy was it to get your issue resolved?") when you want to find friction in the support process.
For a survey sent after a support conversation, one to three questions is enough. SurveyMonkey's analysis of roughly 100,000 surveys found that people spend about 5 minutes on a 10 question survey, that abandon rates rise once a survey takes more than 7 to 8 minutes, and that tolerance for long surveys is lower when the survey is customer related.
Count the responses of 4 (satisfied) and 5 (very satisfied) on a 1 to 5 scale, divide by the total number of responses, and multiply by 100. If 70 of 100 people choose 4 or 5, your CSAT is 70%. Kora Reply has a free CSAT calculator that does the math for you.
CSAT asks how satisfied someone was with a specific interaction or product. NPS asks how likely they are to recommend you, on a 0 to 10 scale, and measures overall loyalty. CES asks how easy it was to get an issue resolved and is best for spotting friction in support.
Send it right after the moment you want to measure: when a ticket is resolved, after onboarding, or after a purchase is delivered. Asking within minutes or hours keeps the memory fresh. Relationship surveys like NPS work better on a fixed schedule, such as every quarter, rather than after every conversation.
Use both. Closed rating questions are easier to answer and to track over time, while open questions explain the score. AAPOR notes that closed questions place less burden on respondents but are more likely to influence how they answer, so pair one rating with one short open question.
There is no single benchmark that fits every channel and industry, so compare your rate against your own past results rather than a generic number. The levers you control are survey length, timing, and making the first question answerable with one click.
Sources
Every statistic and quoted guideline in this article comes from the pages below, checked on October 25, 2026.
- SurveyMonkey, How long should a survey be? Research-backed best practices: sample of roughly 100,000 surveys, seconds per question, 7 to 8 minute abandon threshold, 5% to 20% completion drop, lower tolerance for customer surveys.
- Qualtrics, What is CSAT and how do you measure it?: CSAT formula using responses of 4 and 5, top two values as a retention predictor.
- Bain & Company, Measuring your Net Promoter Score: NPS question, 0 to 10 scale, promoter and detractor ranges, passives' repurchase and referral rates up to 50% lower.
- Qualtrics, Customer Effort Score (CES): CES question, 2010 CEB research, signs of high-effort experiences.
- AAPOR, Best Practices for Survey Research: one concept per question, short and unbiased wording, general before specific, closed versus open questions.
- Nielsen Norman Group, Rating Scales in UX Research: higher cognitive demand of unlabeled options, acquiescence and social desirability bias in Likert items.
- Nielsen Norman Group, Qualitative Surveys: fatigue from open-ended questions, two short surveys over one long survey.
- Frederick F. Reichheld, Harvard Business Review, The One Number You Need to Grow (December 2003).
- Matthew Dixon, Karen Freeman and Nick Toman, Harvard Business Review, Stop Trying to Delight Your Customers (July to August 2010).
Related articles
 Support skills
Customer Service Email: Write Replies That Solve Problems
How to write a customer service email that fixes the problem in one reply: structure, tone, response times, and 6 email customer service examples to adapt.Read article Shared inbox